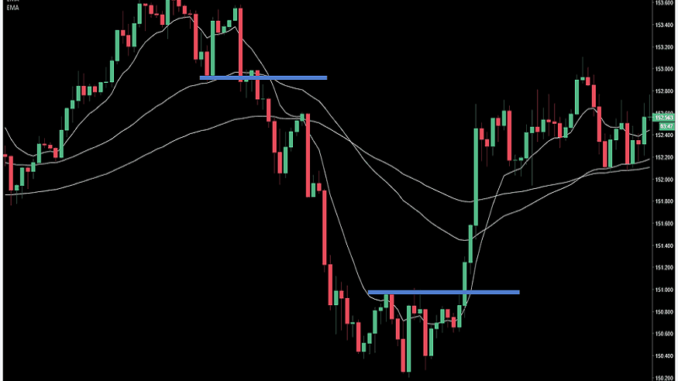
Forex trading has become a popular currency exchange industry, and many people are making profits successfully from this market. However, as a beginner, you should be careful of using the investment or capital here. Being successful in this industry can be quite challenging because of the industry’s volatility.
To earn profits consistently, one must be highly experienced and professional in this market. In this business world, there are two kinds of analyses – fundamental and technical analysis. Fundamental analysts deal with external factors like news events, economic recession, performance, and so on. In fact, analyzing the incidents that affect the currency’s value is called fundamental analysis. On the other hand, technical tools analyze the graph and the movement of the price to show the approaching and possible movements. If you are a short-term investor, we suggest you practice using the technical tools with a demo account. Technical indicators can assist newbie traders in making accurate decisions.
Best technical indicators for the Forex industry
There are several analytical tools in this CFD platform, and those tools are divided into two groups or methods – i) oscillators, ii) resistance, and support. Experts have developed all the tools based on these two main methods. Let’s see those top indicators for the currency investors –
Top FX oscillators
At first, we will take a look at the oscillators –
Stochastics
This is used to determine whether the purchased currency is being oversold or underbought. This is very popular among experts because it can quickly predict the approaching movement of the market. The values of slow stochastics and fast stochastics are interpreted on a scale of 0 to 100. Values less than 20 means that the instrument is oversold, and a value of more than 80 means that the currency/instrument is overbought. Thousands of traders in the CFD market is using this tool a classic trade filter. By managing to learn its core function, can easily become a top trader in the Mena region.
Relative strength index
It is called the momentum oscillator, which is widely used by experienced businessmen. Calculating the RSI seems to be challenging for some traders, but it can be beneficial. To measure the RSI, you have to determine the average profit, average loss, and then relative strength. Relative strength is calculated from the ratio of average profit and average loss. Once you determine the RS, use this formula to calculate the RSI –
RSI = 100 – {100 / (1 + relative strength)}
MACD (moving average convergence divergence)
It is a momentum indicator, which is considered a powerful theory in this business industry. The MACD is defined as the difference between a higher period of EMA and a lower period of EMA. Once the calculation is finished, the software will show you a single line. In addition to this, you can also see a histogram.
Top resistance and support indicators
1. Bollinger bands
It is a popular technical analyzing tool, and it is mainly used to check the market’s volatility. The trader may see two different bands with a gap. The wider gap indicates that the platform is volatile, and the narrower gap suggests that the market is ranging. The bands are used to identify the exit and entry points.
2. Average true range
It concentrates mainly on the volatility of the price and is similar to the Bollinger bands. The element of this tool is the range, which is calculated from the difference between the periodic high and the periodic low. Newbies can utilize this in intraday or multi-day durations.
3. Pivot points
These points establish resistance and support areas by analyzing the closing, lows, and highs of the security. To predict the currency’s flow, price action, breakouts, or retracement, these points can be used. You can determine the pivot points by using the following formula –
Pivot = (Sum of highs, lows, and closes) / 3
These are considered to be the best indicators for the CFD business world, and one can utilize these tools in their demo accounts to become experts.

Leave a Reply
You must be logged in to post a comment.